From Grafana Cloud to Distributed Prometheus and Thanos
2025-12-08

Jonathan Ho
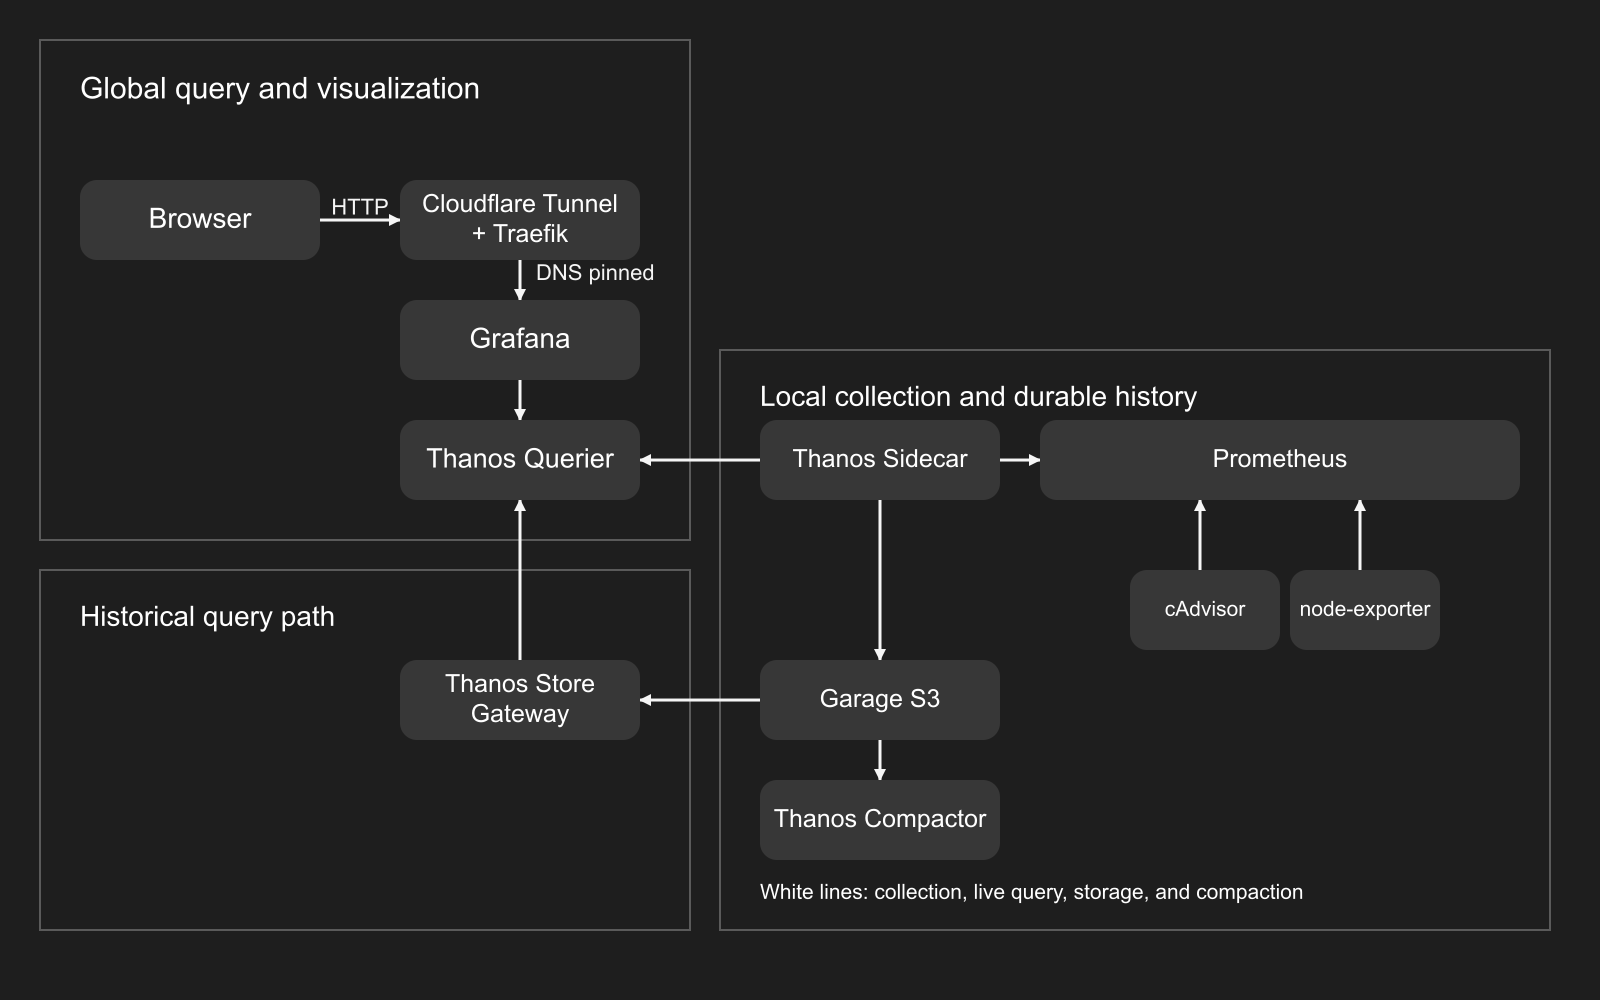
For a long time, monitoring was one of the parts of JH0project I deliberately didn't self-host. I used Grafana Alloy to collect metrics and remote_write them to Grafana Cloud. At the time, building a distributed monitoring system felt like a lot of infrastructure for a problem the free tier already solved well enough.
Eventually I started hitting those free-tier limits. Around the same time, some casual reading led me to Cloudflare's Thanos deployment, which made me revisit an assumption I had mostly left alone: maybe self-hosted monitoring didn't require the central Prometheus cluster I had pictured.
What I actually needed
The obvious self-hosted starting point was Prometheus and Grafana. The less obvious question was where Prometheus should run.
JH0project's infrastructure currently has six servers spread across Japan, the US, and the UK. There isn't a core datacenter, and I didn't particularly want monitoring to create one. My original mental model for self-hosting Prometheus was fairly conventional:
That immediately introduces another problem: discovery. A central Prometheus needs to know what to scrape across every server, while JH0project doesn't currently have global service discovery capable of providing that information.
Resources were another constraint. Most of these servers are small Oracle Cloud instances, with around 40 GB of disk allocated per node. Monitoring has to coexist with the applications those servers are actually there to run, so keeping months of full-resolution metrics on each node wasn't particularly attractive.
At the same time, I did want long-term history. For a recent incident, having the original resolution is useful. Six months later, I mostly care whether memory has been gradually increasing, traffic changed after a deployment, or one region consistently uses more resources than another. I don't need every original sample forever to answer those questions.
The rough requirements became: distributed collection, relatively low memory and local-storage usage, long-term downsampled history, one global query interface, and preferably no dependency on global service discovery just to collect metrics.
Looking for the backend
I didn't start with a neat shortlist of monitoring systems. The different options came from researching different parts of the problem.
ClickHouse
I already knew both Prometheus and ClickHouse, and initially considered either of them as the basis of the system. ClickHouse was attractive mainly because of its performance, but using it would leave much more of the monitoring system for me to design: ingestion, metric representation, aggregation, retention, and how Grafana should query it.
ClickHouse is a very capable database, but I wasn't trying to build a metrics system around a general analytical database. I wanted to operate a monitoring system.
VictoriaMetrics
One reason I had previously avoided self-hosting Prometheus was my assumption that it would consume too much memory on these small servers. Searching specifically for lower-memory Prometheus alternatives led me to VictoriaMetrics.
This was much closer to what I wanted. Its resource efficiency was attractive, but the part that didn't fit was the long-term storage lifecycle. I wanted old high-resolution data to eventually become lower-resolution data, retaining the trend without retaining every original sample forever. The multi-resolution downsampling functionality I was looking for wasn't part of the open-source setup I wanted to run.
VictoriaMetrics solved the resource concern well, but not quite the storage model I had in mind.
Mimir
Another branch of the research was essentially asking what a clustered Prometheus architecture looked like, which led me to Grafana Mimir. It solves the distributed metrics-backend problem, but still meant operating a central distributed cluster that everything else sends data into. It solved how to scale the central system while I was increasingly questioning why I needed one in the first place.
Thanos
Thanos came from a different direction. While casually reading Cloudflare's engineering blog, I came across how they used Thanos around Prometheus. Their scale obviously has very little in common with my six servers, but the topology was much more interesting to me than the scale.
Instead of one Prometheus discovering and scraping everything, each Prometheus could collect independently and another layer could assemble the global view afterward.
That changed the question from:
How do I make one Prometheus discover every service?
to:
Why does Prometheus need to discover anything outside its own node?
That fit JH0project much better.
Testing Prometheus instead of assuming
There was still one problem: this architecture meant running Prometheus on every server, while I had started the research assuming Prometheus was too memory-heavy to do that.
Eventually I stopped comparing other people's benchmarks and deployed it on one of my actual nodes. After tuning it and watching the resource usage, it was fine. I don't have the original measurement anymore, so I'm not going to manufacture a RAM number, but the important result was that Prometheus itself was much less problematic than I expected.
That made a completely different topology viable:
Each Prometheus only needs to understand its own server. Global discovery is no longer required for collection.
Garage made Thanos unusually convenient
Thanos introduced one major infrastructure requirement: object storage.
Fortunately, I already had it.
Garage actually predates the current image-processing CDN. I deployed it after the first generation and before building Gen 2, specifically because I needed a lightweight distributed object-storage layer that could survive independently of any one application.
So when Thanos wanted an object-storage layer shared between all of the Prometheus instances, I didn't need to introduce another distributed storage system. Garage was already running across the same fleet.
That was enough to stop researching and start building.
Deploying one piece at a time
I didn't deploy the entire monitoring stack across all six servers at once. There were enough moving parts that doing so would make every failure ambiguous: Prometheus, Thanos, Garage, Coolify, networking, filesystem permissions, or simply something different about one of the remote nodes.
I started with one server and one very boring Prometheus.
Prometheus and one Sidecar
Prometheus initially only scraped itself. That wasn't useful monitoring yet, but it was enough data to verify that it was collecting samples, producing TSDB data, and behaving reasonably on one of the actual servers.
Then I added a Thanos Sidecar:
This immediately found the first problem.
The Sidecar needed access to Prometheus's TSDB volume. With the shared volume in my Coolify deployment, Thanos failed while trying to hard-link blocks:
hard link block
operation not permitted
The architecture diagram had said Prometheus → Sidecar. The actual implementation involved container users, filesystem ownership, shared volumes, and hard-link permissions.
The pragmatic fix was a custom Thanos image ending with:
USER root
I wouldn't normally make a container root without a reason, but here it fixed the interaction with the existing shared volume and let me continue testing the actual architecture.
Then S3 didn't quite work
The next path was:
Garage was already running, but the way I expose its S3 API matters.
Virtual-host-style S3 addressing would produce endpoints such as:
bucket.s3.jh0project.com
That is awkward with my Cloudflare Tunnel and TLS setup because the bucket adds another hostname level. I didn't want creating an S3 bucket to also create another DNS, ingress, and certificate problem.
Path-style addressing keeps one endpoint:
s3.jh0project.com/bucket
For Thanos, that meant explicitly setting:
bucket_lookup_type: path
The Thanos bucket is:
thanos-metrics
Once that was fixed, the first complete storage path worked. Prometheus could collect locally, the Sidecar could upload completed blocks, and Garage could provide the durable shared storage layer.
Only then did I repeat the Prometheus + Sidecar deployment across the rest of the fleet:
At this point I had distributed collection and distributed historical storage. I still didn't have a particularly useful way to query it.
Adding the query side
The next phase started on one node again.
On us-e-o-a-2, I deployed the Thanos Store Gateway and Querier, then put Grafana in front of the Querier:
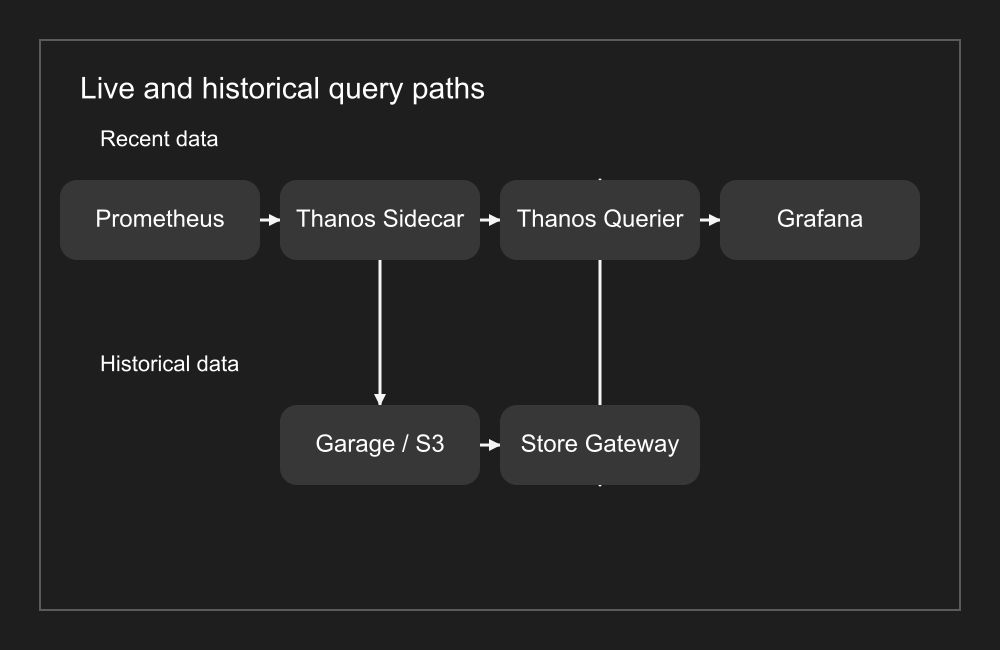
The Compactor also runs there, handling compaction, retention, garbage collection, and the downsampling that was one of the original requirements.
I deliberately kept this query side on one node first instead of immediately trying to make it highly available. That reduced the number of variables while I worked out whether the architecture actually behaved the way I expected.
Grafana quickly provided the next variable anyway.
Grafana and Cloudflare Tunnel
Most public JH0project services are normally reached through Cloudflare Tunnel and then Traefik:
I initially tried treating Grafana the same way, but its WebSocket/streaming behaviour didn't work correctly through my distributed Tunnel setup when the connection could end up on different instances.
Rather than turning Grafana itself into another infrastructure project, I kept it on us-e-o-a-2 and pinned grafana.jh0project.com to that server instead of letting the normal distributed ingress path choose a target.
This is a single point of failure for the global UI and query plane, but not for metric collection. If this server disappears, the other Prometheus instances continue collecting locally and their completed blocks can still be uploaded into Garage.
That was an acceptable trade-off for now.
Where are the newest metrics?
With Grafana connected, the system finally looked complete enough to use rather than just test.
Then I noticed that the newest metrics were missing.
There was roughly a two-hour hole at the end of the timeline.
The reason is a consequence of how the Thanos storage path works. Prometheus doesn't continuously stream every sample into Garage. It keeps its current data locally and periodically produces completed TSDB blocks, which the Sidecar can then upload to object storage.
In my deployment, that leaves roughly the current two-hour block unavailable through the object-storage path.
So this works very well for history:
But it doesn't provide the data still sitting inside Prometheus.
Thanos solves this by having Querier also talk directly to each Sidecar:
The Store Gateway fills in the historical data. The Sidecars fill in the recent data.
And with that, service discovery came back.
Reaching the Sidecars without service discovery
The Sidecars are containers, and their Docker addresses aren't something I wanted to manually feed into Querier after every deployment. The obvious solution would be to publish Sidecar's gRPC port on each host, but I didn't particularly like that either.
Part of the mental model I use for this infrastructure is that each JH0project node is closer to a tiny datacenter or rack than to an individual application server. BIRD is effectively the top-of-rack router, while each Docker service is a server inside that rack. Publishing every internal service through the node would couple it to the host, add to the exposed host surface, and make rolling replacement less clean. You don't bind every server to the IP of its datacenter; the network routes you to the server.
What I did have was IPv6. Each JH0project node owns a routed IPv6 subnet on DN42, and BIRD already advertises the routes between them. That gave me a cheap temporary substitute for discovery: give the Thanos Sidecar the same host portion inside every node's subnet.
<node IPv6 subnet>::9090
Yes, 9090 — the default Prometheus port — as the IPv6 address for a Thanos Sidecar. Just to make future debugging slightly more entertaining.
The Sidecar itself still serves Thanos gRPC on TCP 10901, so an endpoint actually looks like:
[node-subnet::9090]:10901
Querier has a static list of those six endpoints. It isn't service discovery, but maintaining six entries is perfectly affordable until I actually have service discovery. More importantly, Querier doesn't need to know which particular container currently owns the address. A Sidecar can be replaced, take back ::9090, and keep the same network identity.
The resulting path is:
Querier
   │
   │ [node-subnet::9090]:10901
   ▼
DN42
   │
   ▼
BIRD / node
"ToR router / rack"
   │
   ▼
Docker network
   │
   ▼
Sidecar
"server"
For six nodes, routing plus deterministic addressing gets surprisingly close to what I need without first building a control plane.
Until Docker reminded me there was still a firewall between my imaginary top-of-rack router and my imaginary server.
When four Sidecars disappeared
At some point Querier could suddenly reach only two of the six Sidecars. The other four repeatedly failed with DeadlineExceeded. Given the unusual addressing setup I had just built, routing was the obvious suspect.
The Sidecars were running and worked locally. The remote nodes were reachable, BIRD had the routes, DNS worked, and the routes to the container subnets existed. Eventually the interesting difference turned out to be much closer to the destination:
IPv4:
iptables -P FORWARD ACCEPT

IPv6:
ip6tables -P FORWARD DROP
The actual path looked like this:
Querier
   │
   │ DN42 IPv6
   ▼
remote node
   │
   ▼
BIRD / kernel routing
   │
   ▼
ip6tables FORWARD
   │
   X DROP
   │
   ▼
Docker IPv6 network
   │
   ▼
Sidecar ::9090 / TCP 10901
The network had successfully routed the packet to the correct node. The node then dropped it while trying to forward it into Docker's IPv6 network.
Docker's ip6tables integration had recreated the IPv6 filtering state after a Docker restart. IPv4 forwarding remained permissive while IPv6 had returned to DROP.
The immediate repair was:
iptables -P FORWARD ACCEPT
ip6tables -P FORWARD ACCEPT
After applying it, I tested TCP 10901 both from the hosts and from inside the actual Querier container. All six Sidecars came back and the DeadlineExceeded errors disappeared.
The routing design hadn't failed. The host-to-container forwarding underneath it had.
Update: Docker 28 makes this setup cleaner. Using a nat-unprotected network together with ip-forward-no-drop better matches what I'm trying to do: Docker can enable IP forwarding without changing the forwarding policy back to DROP, while the directly routed container network can remain reachable without relying on the broad manual FORWARD ACCEPT workaround. I still want tighter network policy around it, but at least this means fighting Docker's default firewall behaviour less.
Adding useful metrics
Up to this point, Prometheus scraping itself had been enough to build and debug the monitoring infrastructure. Once the storage and query paths worked, I finally needed to make it monitor something useful.
The first thing I wanted was container-level visibility. Each node runs multiple services, so knowing that a server is using a lot of memory isn't nearly as useful as knowing which container is using it.
Searching around that problem led me to cAdvisor.
cAdvisor gave Prometheus the per-container CPU, memory, and other resource metrics I wanted. Its metric set isn't particularly clean, though. I found noisy series, empty labels, and memory metrics that needed some care when building the Grafana queries. Some queries ended up with filters such as:
container_memory_usage_bytes{
  image!=""
}
It was still the right layer for answering which container was consuming resources.
Then I compared the container view against the server itself and found that the host-level numbers didn't line up cleanly with what I could derive from cAdvisor. I don't remember the exact discrepancy that originally triggered that investigation, so I'm not going to reconstruct one after the fact. The useful conclusion was that container metrics weren't a replacement for host metrics.
There is resource usage outside Docker, and cAdvisor is fundamentally observing a different layer of the system. So I added node-exporter separately for host-level CPU, memory, filesystem, disk, and network metrics.
The overlap is intentional:
node-exporter tells me what the machine is doing. cAdvisor helps explain what the containers on that machine are doing.
What is running now
The resulting monitoring stack runs across six servers: jp-3-a and jp-1-b in Japan, us-e-o-a-2 and us-e-o-b-2 in the US, and uk-s-o-a-1 and uk-s-o-b-1 in the UK.
Every node runs cAdvisor, node-exporter, Prometheus, a Thanos Sidecar, and Garage. Prometheus currently scrapes cadvisor, docker, node-exporter, and itself. Collection remains completely local to each node:
Completed blocks asynchronously leave that local collection path through the Sidecar and end up in Garage:
The live and historical query paths then split. Recent data comes directly from each Prometheus through its Sidecar, while historical data comes back from Garage through the Store Gateway.
us-e-o-a-2 currently runs Grafana, Thanos Querier, Store Gateway, and Compactor. That makes the global query plane centralized, but collection and historical storage are not.
The Compactor operates against the thanos-metrics Garage bucket, compacting blocks and producing the lower-resolution historical data that was one of the original reasons I chose this architecture. The limited local disk on each Oracle node therefore doesn't need to become the long-term metrics archive.
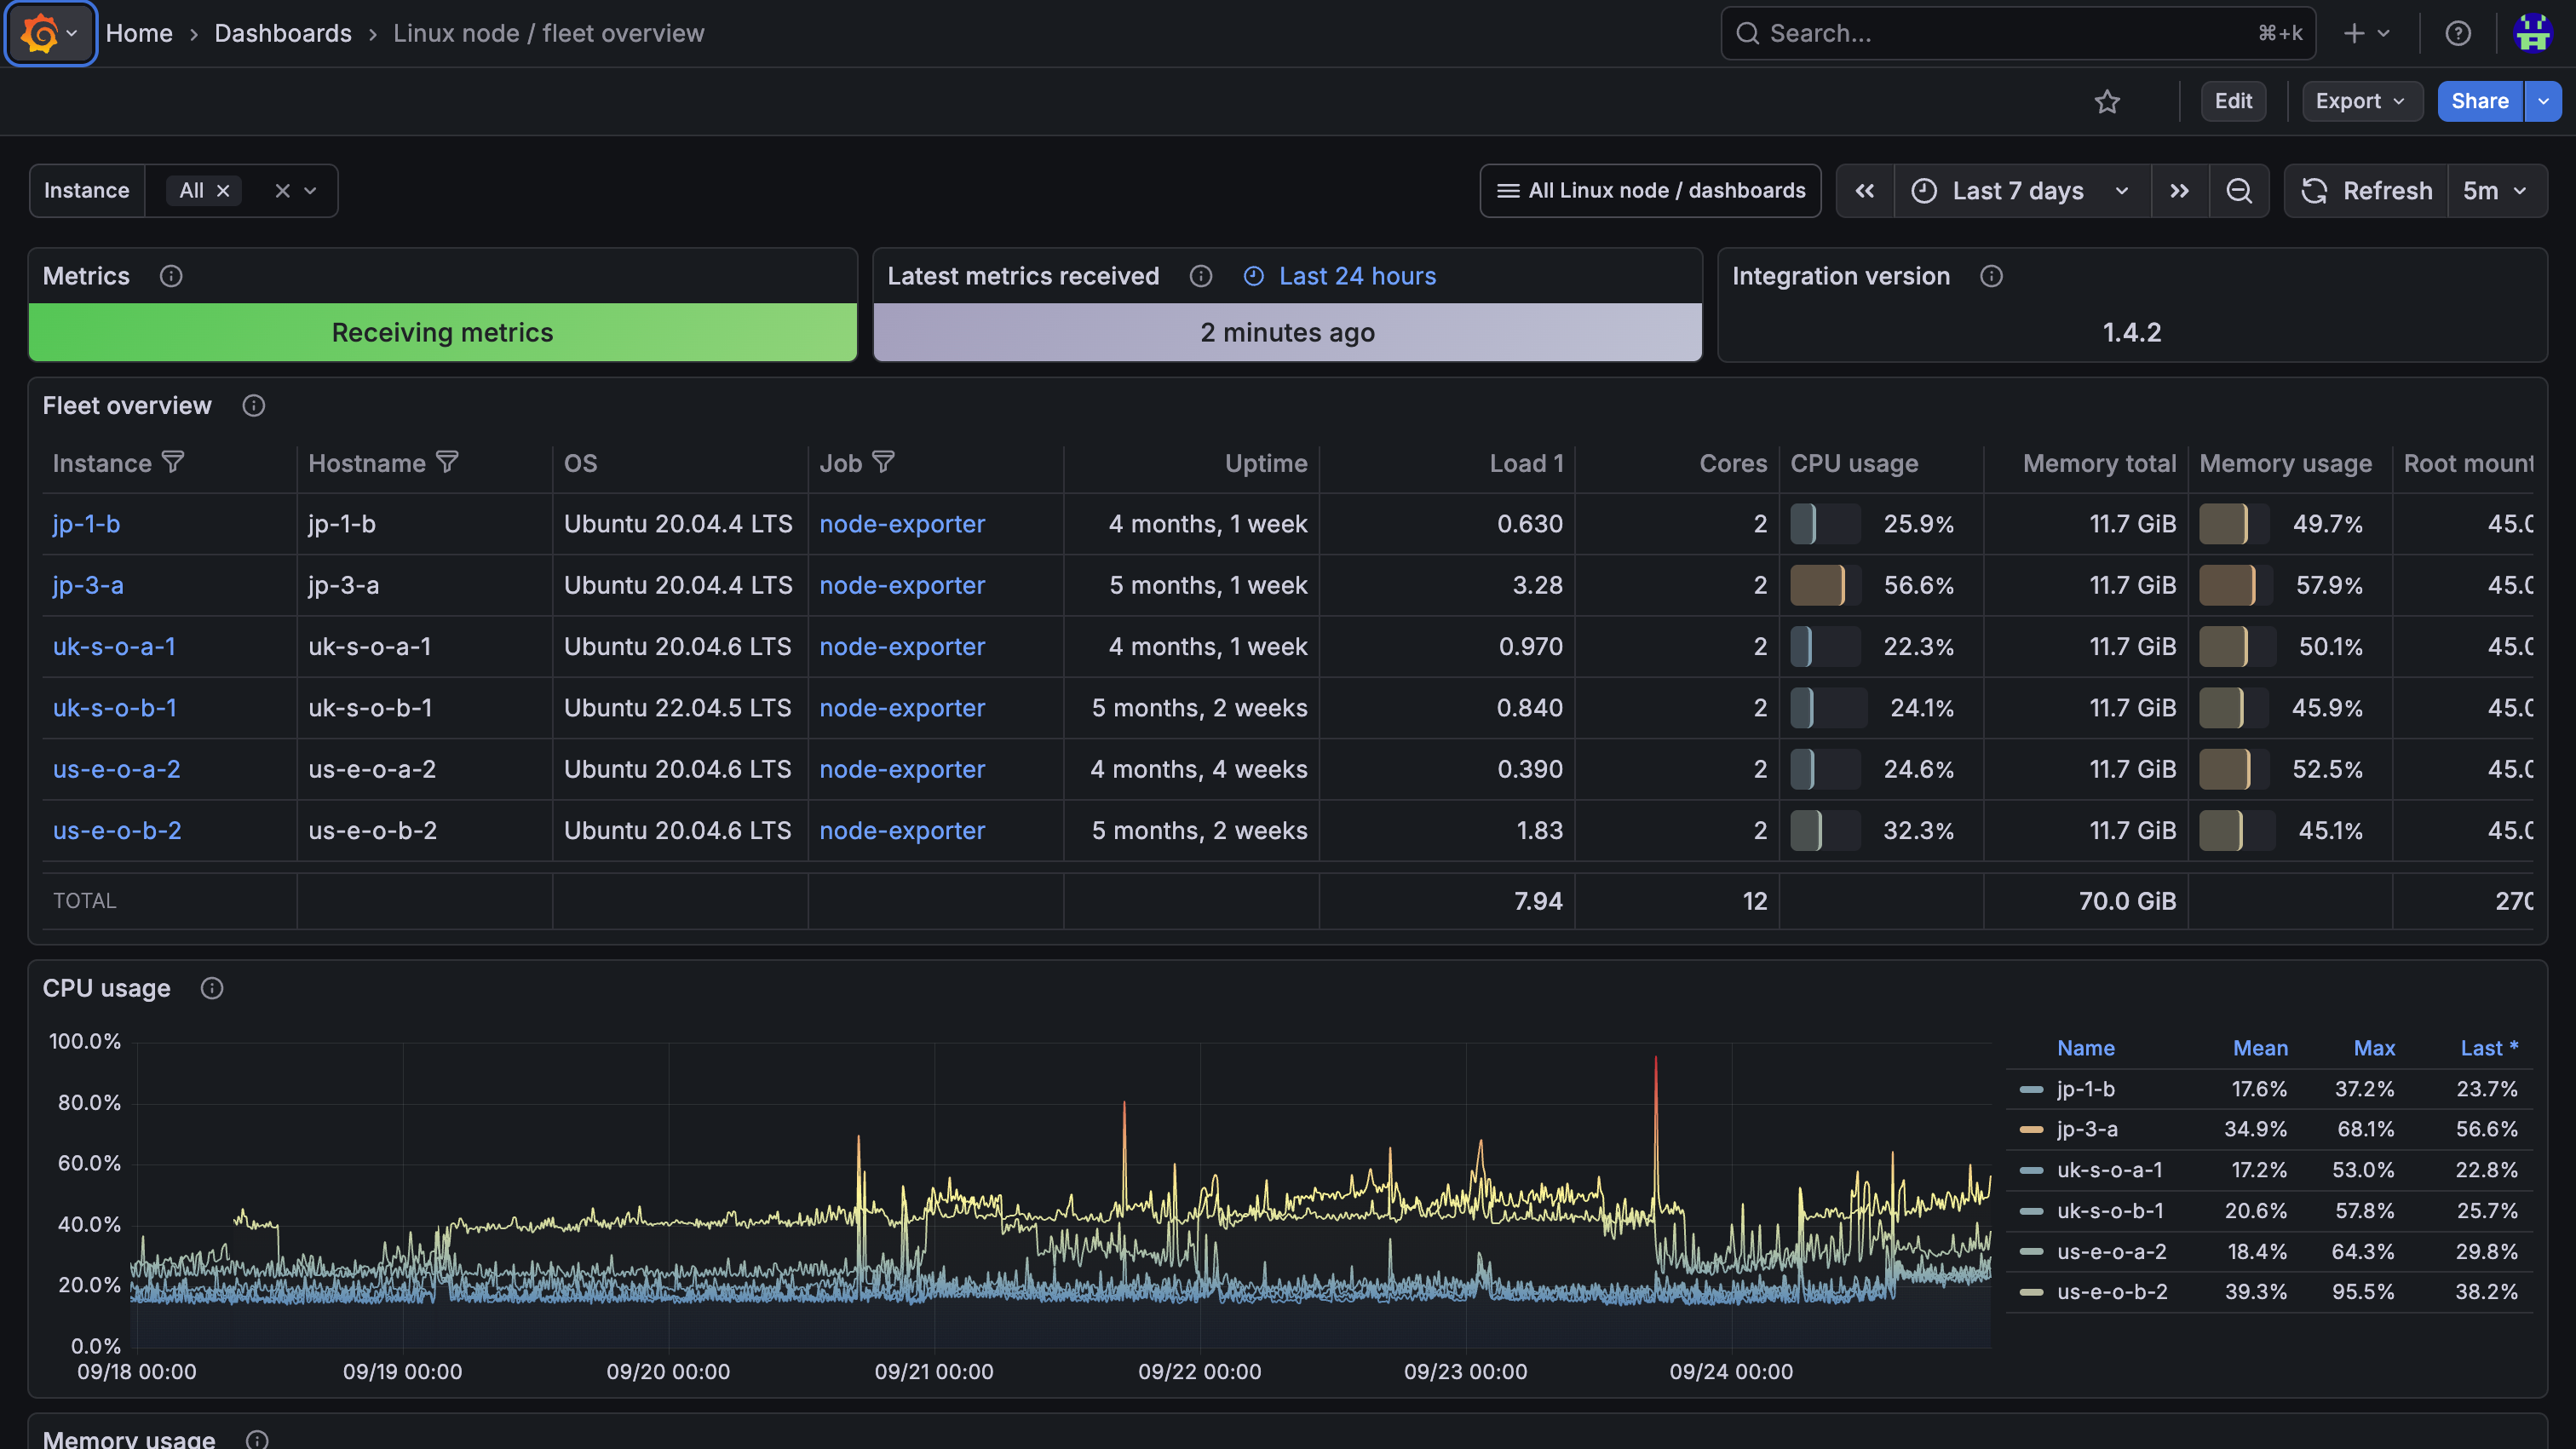
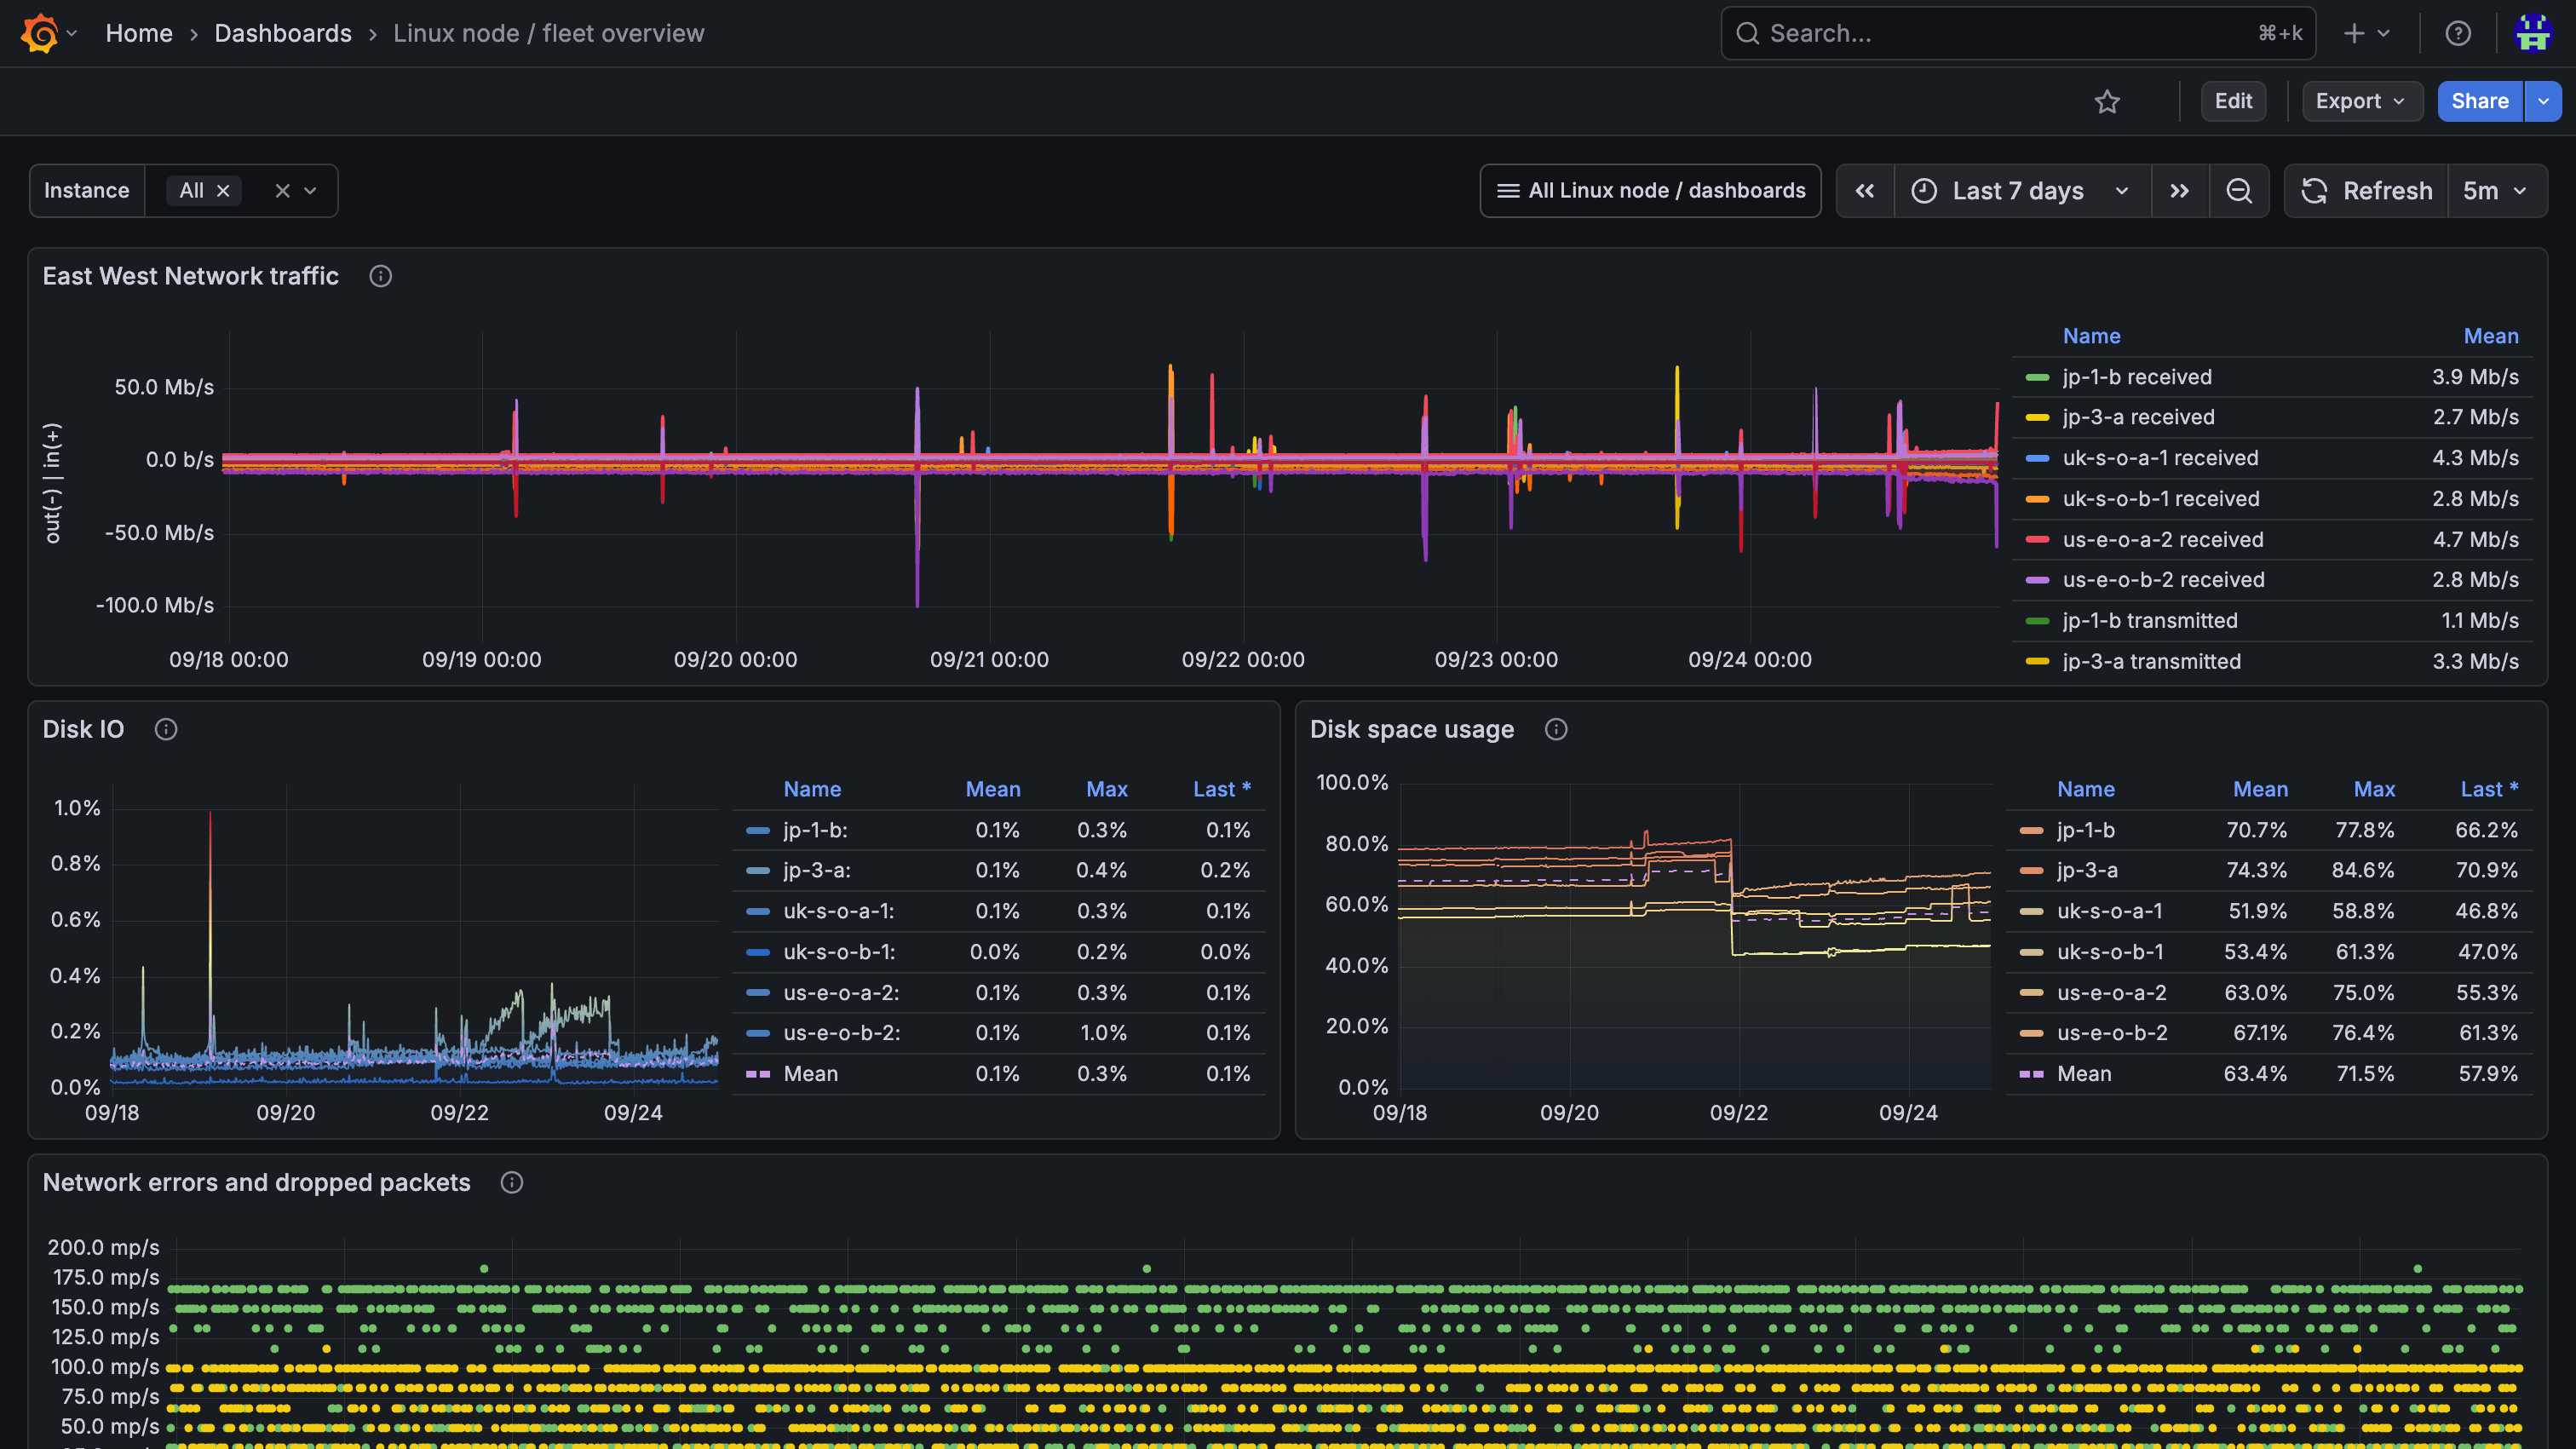
The resulting Grafana dashboard is still fairly operational rather than polished. The fleet overview shows the six nodes together, including their operating system, uptime, load, CPU, memory, and root filesystem usage:
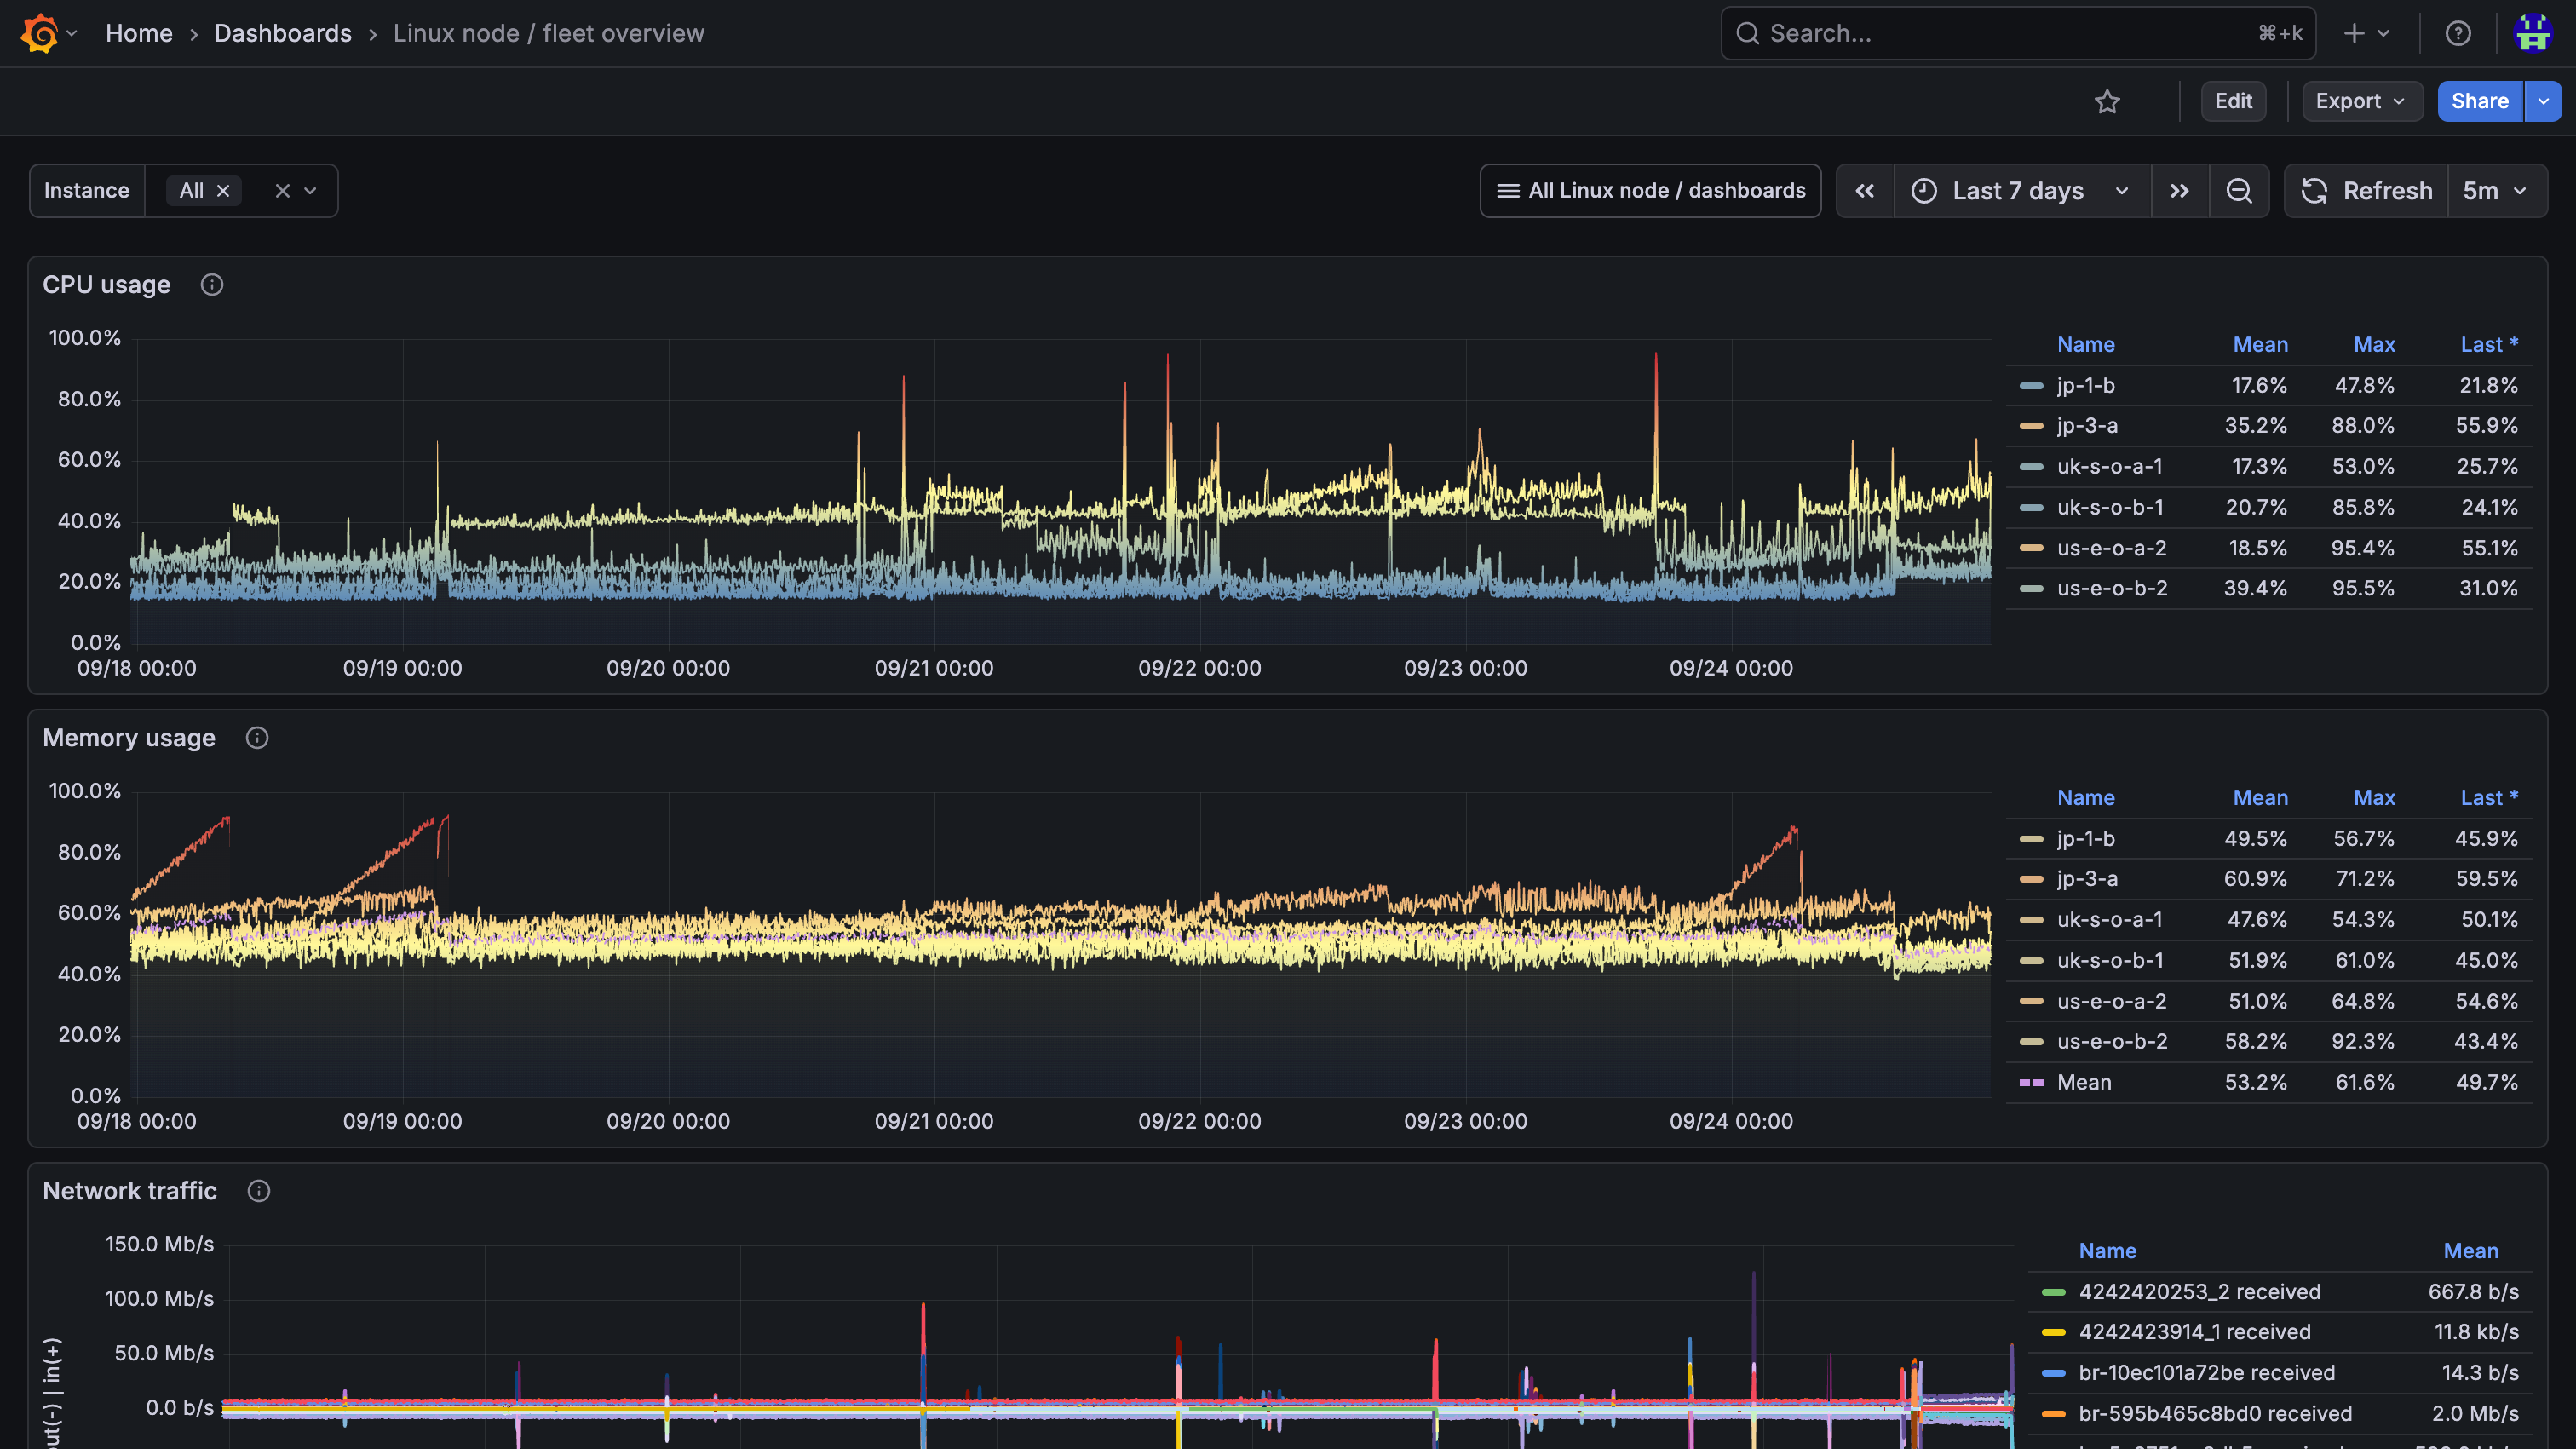
The detailed panels then show the resource and network behaviour that the dashboard is meant to make visible:
I may also keep sending a reduced metric set to Grafana Cloud as a backup as long as it remains inside the free tier and has negligible overhead. There is some value in having a monitoring path outside the infrastructure it is supposed to monitor. The goal wasn't to self-host everything for the sake of self-hosting; it was to stop making that external path my only source of visibility.
Where I ended up
The architecture I originally imagined had one central collector responsible for seeing the entire infrastructure:
What I ended up with is almost the inverse:
The interesting change isn't really that I replaced Grafana Cloud with Prometheus and Thanos. It is where the system now requires coordination.
Collection doesn't require much coordination at all. Every node is responsible for observing itself, and a network problem between regions doesn't stop that. Historical storage converges asynchronously through Garage. Only the global live-query path needs Querier to reach every node.
The IPv6 failure demonstrated that boundary better than the architecture diagram did. Four Sidecars became unreachable from Querier, but the four Prometheus instances behind them continued collecting metrics. I managed to break most of the global live view without breaking monitoring at the source.
That is a much better failure mode than the central Prometheus architecture I originally had in mind.
What's next
The remaining weakness is also much easier to see now. I avoided requiring global service discovery for metric collection, but live global querying still needs to know where every Sidecar lives.
For six nodes, maintaining six deterministic [subnet::9090]:10901 endpoints is cheap enough. It isn't worth building an entire service-discovery system solely to remove those six lines of configuration.
But monitoring isn't the only place where this problem is appearing.
As JH0project grows, more things need to answer the same questions: where a service is running, whether it is healthy, which instance is local to a region, where traffic should fail over, and what happens when a service moves during a deployment.
The Sidecar addresses are therefore probably temporary, but not because they don't work. They work well enough that I can leave them alone until there is a real service-discovery layer worth replacing them with.
That is probably the more useful outcome of this monitoring rebuild. I didn't need to solve service discovery, build a central datacenter, or operate a large metrics cluster before I could own the monitoring stack.
Each node can collect first. Everything else can be assembled afterward.